

Pass Google Business verification with a video-first checklist. Film one continuous 30 second take, fix flagged issues, and know when to hire help.
How to Increase Website Conversions: a Data-First Playbook
The fastest route to higher conversions is not more traffic. Fix your value proposition, remove form friction, and run prioritized A/B tests against a real analytics baseline. Do those three things before anything else, and you will see measurable lift within weeks, not months.
CRO delivers higher ROI than buying more traffic because a small percentage gain compounds across every visitor you already have. A site with improved conversion rate can significantly increase its lead volume without spending extra on ads.
Your immediate action checklist:
- Set one primary conversion KPI (phone call, form submission, purchase, or demo booked) before touching anything else
- Instrument GA4 plus Google Tag Manager and add a session-recording tool such as Hotjar
- Run one headline or CTA test and one form-reduction test this week
- If traffic or internal bandwidth is limited, contact City Web Company for a scoped audit before spending time on low-impact changes
The sections below follow that priority order: goal-setting and baseline first, then prioritization, testing, copy, forms, trust, personalization, technical fixes, measurement, and timelines. Jump to the section that matches your next step.
Table of Contents
Table of Contents
- What conversion goal should you set before optimizing anything?
- How do you prioritize fixes so you test the right things first?
- How do you run A/B tests that produce results you can actually trust?
- Which UX and copy changes move the needle fastest?
- How do you reduce form and checkout friction to recover lost conversions?
- Where should you place trust signals to actually increase conversions?
- How does personalization help you convert more visitors?
- Which technical fixes have the biggest impact on your conversion rate?
- How do you measure real conversion lift and avoid attribution mistakes?
- What does a realistic CRO timeline and budget look like?
- How City Web Company approaches CRO for local service businesses
- Key Takeaways
- What actually works for local service businesses (a practitioner’s view)
- City Web Company can audit and fix your conversion rate
- Useful sources and tools for going deeper
- FAQ
What conversion goal should you set before optimizing anything?
The most common CRO mistake is starting without a specific, measurable conversion goal. Reading a blog post is not a conversion. Clicking a button is not a conversion unless that click triggers a business outcome you can tie to revenue.
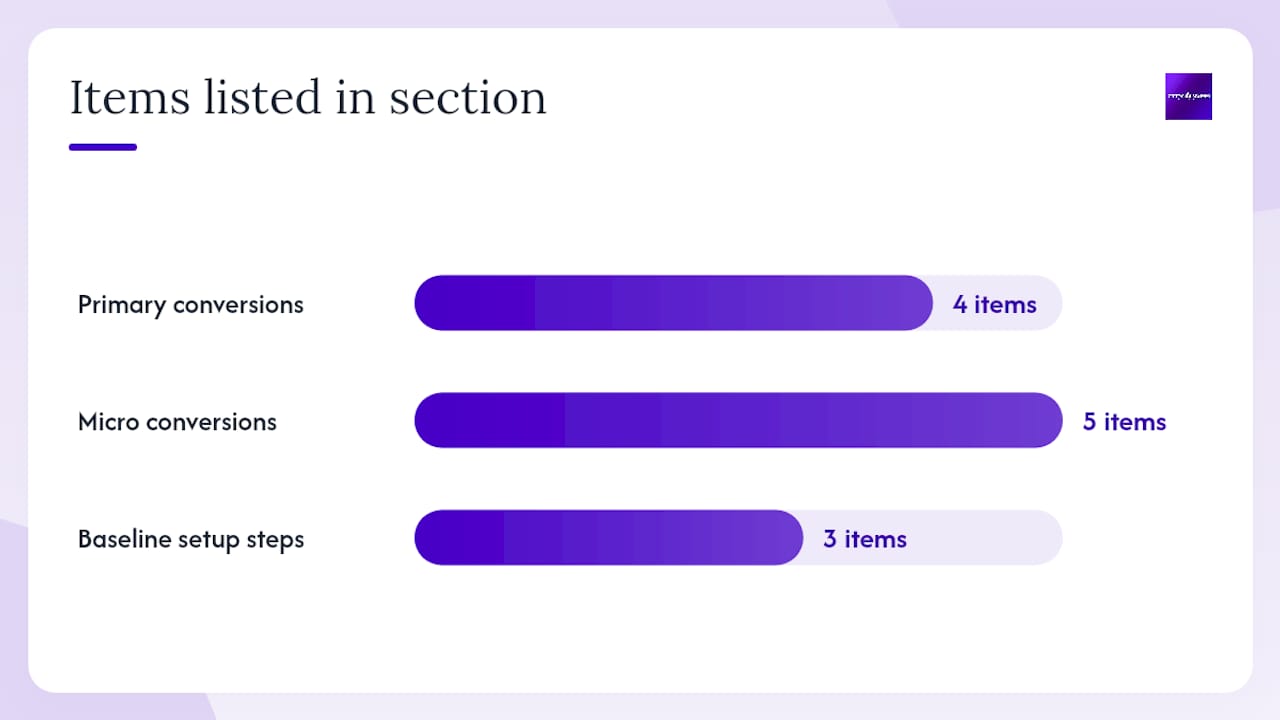
Primary conversions are the actions that directly produce revenue or a qualified lead: a purchase, a phone call, a demo request, a booked appointment. Pick one. Every test, every fix, and every report you produce should point back to that single metric.
Micro conversions support the primary goal and help you understand where visitors drop off. Common examples include:
- Content download or lead magnet opt-in
- Video play past 50%
- Add-to-cart or “save for later”
- Pricing page visit
- Live chat initiated
Once you have your primary KPI defined, build the baseline in three steps.
- Set up GA4 event tracking via Google Tag Manager. Tag your primary conversion action as a GA4 conversion event. Google Tag Manager lets you deploy and modify tags without touching code, which matters when you need to iterate quickly.
- Build a funnel exploration in GA4. Map the steps from landing page to conversion. GA4’s Funnel Exploration report shows you exactly where visitors exit at each step, which is where your first tests should focus.
- Add Hotjar (or Microsoft Clarity, which is free) for session-level insight. Heatmaps show where users click and scroll; recordings show what they actually do before they leave. These two data sources together reveal friction that GA4 numbers alone cannot explain.
Record your baseline conversion rate, total conversion volume, and the date range you used. A reliable baseline needs at least one full business cycle.
Pro Tip: Capture at least 7–14 days of session recordings before making any site changes. Once you alter the page, those recordings become a different experiment. Raw pre-change recordings are the only honest before-state you will ever have.
How do you prioritize fixes so you test the right things first?
Most teams run too many low-impact tests and wonder why their conversion rate barely moves. A scoring framework forces you to bet on the biggest levers first.
The ICE framework scores each idea on three dimensions: Impact (how much will this move the primary KPI?), Confidence (how strong is the evidence?), and Ease (how fast can you build and launch it?). Score each dimension 1–10 and average the three scores. The highest ICE score runs first.
Here is a worked example with three common candidates:
- Hero headline rewrite — (Impact: 9, Confidence: 8, Ease: 7 = ICE 8.0). Value proposition clarity has roughly three times the impact on conversions as reducing friction, so headline tests almost always score at the top of any honest ICE list.
The headline test runs first. The form and speed fix tie on score, so run the form test next because its business impact is higher.
Estimating the actual lift: If your site gets 5,000 monthly visitors and converts at 2% (100 conversions), a 5% relative lift in conversion rate produces 5 additional conversions per month. At a $500 average lead value, that is $2,500 in monthly revenue from one test. Run that math before scoring anything. It keeps the team focused on revenue, not activity.
The workflow is: identify candidates from GA4 funnel data and session recordings, score with ICE, design the experiment, estimate business impact, then schedule. Repeat every sprint.
How do you run A/B tests that produce results you can actually trust?
Testing is mandatory for confident optimization. Without a controlled experiment, you cannot separate the effect of your change from seasonal traffic shifts, a new ad campaign, or a Google algorithm update.
Before you run any test, confirm you meet the statistical minimums.
| Requirement | Rule of Thumb | Why It Matters |
|---|---|---|
| Conversions per variant | 200+ per variant | Below this, results are noise, not signal |
| Test duration | Minimum 2 full business cycles | Avoids day-of-week and seasonal bias |
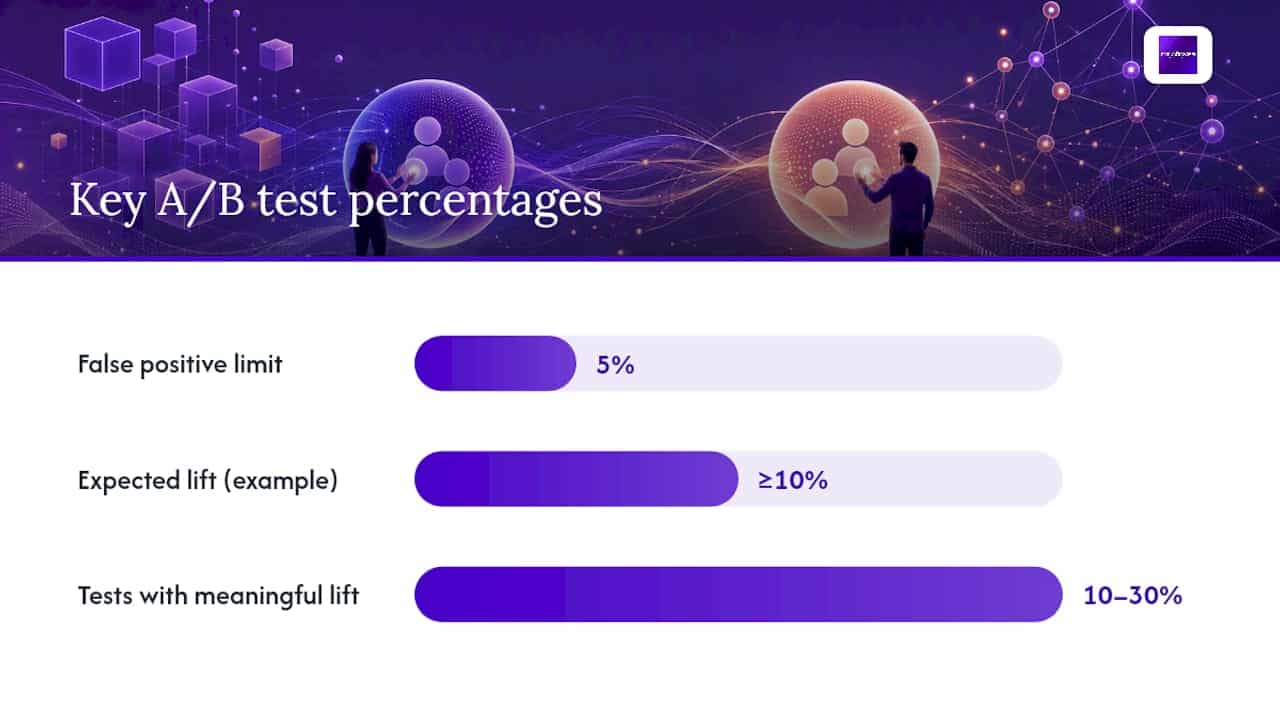
| Confidence level | — | Limits false positives to 5% |
| Variables per test | One at a time for A/B | Multivariate needs much higher traffic |
For low-traffic sites, qualitative methods replace standard A/B testing until sufficient conversion volumes exist. If you cannot reach 200 conversions per variant in a reasonable timeframe, use session recordings, user interviews, and heatmap analysis to guide high-confidence changes instead.
Hypothesis template: If [specific change], then [expected effect on primary KPI] because [evidence from data or research].
Example: “If we rewrite the hero headline to lead with the specific service outcome (‘Get a licensed HVAC tech in 2 hours’) instead of the company name, then phone call conversions will increase by at least 10% because session recordings show users scrolling past the hero without clicking, and our heatmap shows zero engagement with the current headline.”
Tool selection matters. Unbounce is purpose-built for landing-page experiments and lets non-developers build and test variants without engineering support. Optimizely handles full-site experimentation and is better suited to teams running multiple concurrent tests across different page types. GA4’s built-in A/B testing covers basic experiments if you are already instrumented and want to avoid a third-party tool subscription.
Pro Tip: Set your test window before you launch, not after. Peeking at results daily and stopping early when you see a lift is the single most common cause of false positives. Write the planned end date in your experiment log and do not touch it.
Only about 10–30% of A/B tests produce meaningful positive lifts, so a documented experiment log is not optional. Every test, win or loss, teaches you something about your visitors. Losses are often more instructive than wins.

Which UX and copy changes move the needle fastest?
Headlines and above-the-fold clarity are the single highest-impact copy levers you have. Not button color. Not font size. The first sentence a visitor reads either confirms they are in the right place or sends them back to Google.
Here is what high-converting copy looks like versus what most sites actually publish:
Hero headline before: “Welcome to [Company Name] — Serving the Region Since 1998”
Hero headline after: “Licensed Plumbers in Denver. Same-Day Service. Upfront Pricing.”
The after version answers three visitor questions in one line: What do you do? Where? What should I expect? That is the job of a headline.
Value proposition checklist for above-the-fold content:
- Lead with the specific outcome the visitor wants, not the service name
- State the geography or audience if it qualifies the offer (local service businesses must do this)
- Include one concrete differentiator (speed, price transparency, guarantee)
- Place the primary CTA within the first viewport, no scrolling required
CTA copy experiments worth running first:
- “Get a Free Quote” vs. “See My Options” vs. “Call Now: [Number]”
- Button color contrast against the page background (test dark-on-light vs. light-on-dark)
- Microcopy below the CTA button (“No commitment. Response in 2 hours.”)
- First-person CTA phrasing (“Start My Free Audit” vs. “Start Your Free Audit”)
A strong call-to-action is not decoration. It is the moment the visitor decides whether to act or leave. Test it with the same rigor you would apply to a pricing change.
Common copy experiments that consistently produce lift: headline benefit-first rewrites, CTA verb changes, removing jargon from service descriptions, and adding a single sentence of social proof directly above the primary button.
How do you reduce form and checkout friction to recover lost conversions?
Remove unnecessary fields and enable guest or one-click payment options. That is the short answer. Everything else in this section is how to execute it.
Cart abandonment is common across industries, often caused by surprise costs revealed late in the process and forced account creation. Fix those two things before optimizing anything else in your checkout.
Step-by-step form optimization:
- Audit every field. Ask: “Do we actually use this data in the first 30 days after a lead submits?” If not, remove it.
- Separate required from optional fields visually. Required fields should be obvious; optional ones should feel genuinely optional.
- Add inline validation so errors appear as the user types, not after they hit submit.
- Use conditional logic to show fields only when relevant. A roofing company does not need to ask about commercial square footage until the visitor selects “commercial property.”
- For longer qualification forms, break them into multi-step flows with a progress indicator. Visitors who see “Step 1 of 3” complete forms at higher rates than those facing a single long page.
- On mobile, use the correct input type for each field (tel for phone, email for email address) so the right keyboard appears automatically.
Mobile form mistakes to fix first:
- Tap targets smaller than 44px (fingers miss them)
- Auto-zoom triggered by font sizes below 16px
- No autofill support on name, address, and phone fields
- Submit button below the fold on small screens
For an A/B test, run your current full checkout against a reduced-field version. Measure completed submissions as the primary metric and time-on-form as a secondary signal. If the shorter form converts better but produces lower-quality leads, you will see that in your CRM data within 30 days. Adjust accordingly. For local service businesses, the click-to-call path often outperforms any form, so test a prominent phone number against a form as a parallel experiment.
Where should you place trust signals to actually increase conversions?
Place clear, relevant trust signals near decision points: directly above or below the primary CTA, on pricing pages, and at the checkout step. Trust signals buried in a footer or an “About” page do almost nothing for conversion rates.
Trust signals by page type:
- Homepage/hero: Client logo bar, review aggregate score (Google rating + count), a one-line guarantee
- Service or product pages: Named testimonials with a specific outcome (“Reduced our HVAC bill by 30%”), before/after photos, certifications relevant to the service
- Pricing pages: Money-back guarantee, “no hidden fees” statement, FAQ addressing the most common objection
- Checkout or contact form: Security badge, privacy statement in plain English, response-time promise (“We respond within 2 business hours”)
Scarcity and exclusivity improve conversions when they are authentic, but fake countdown timers erode long-term trust. A genuine “only 3 spots left this month” for a service business with a real capacity limit is ethical and effective. A timer that resets every time the visitor refreshes the page is not. Visitors notice, and they do not come back.
Dos and don’ts for social proof:
- Do use real metrics: “4.9 stars across 214 Google reviews” beats “customers love us”
- Do name the reviewer and their city or industry when possible
- Do place a testimonial within one scroll of the primary CTA
- Do not use stock photos as “customer” headshots
- Do not fabricate urgency with fake inventory counts
Pro Tip: Test which type of social proof performs best on each page type. A review count might outperform a named testimonial on a pricing page, while a case study metric (“Booked 40% more appointments after redesign”) might outperform both on a service detail page. Run the test; do not assume.
For deeper guidance on making your website more trustworthy, the principles apply across every page type.
How does personalization help you convert more visitors?
Personalization increases conversion relevance most when it matches traffic source and intent. A visitor arriving from a Google Ads campaign for “emergency plumber near me” has a completely different intent than someone who found your blog post about water heater maintenance. Showing them the same homepage is a missed opportunity.
Segmentation checklist to start with:
- Paid vs. organic traffic (different intent, different message needed)
- New vs. returning visitors (returning visitors may need a different CTA or a reminder offer)
- Traffic source (Google Search vs. Facebook vs. email list)
- Device type (mobile visitors convert differently and need mobile-optimized CTAs)
- Geography (local service businesses should show location-specific content to visitors from their service area)
- High-intent behavioral signals (visited pricing page, watched demo video, spent 3+ minutes on a service page)
Two quick content-variant examples:
Paid traffic landing page: Strip navigation, match the ad headline exactly, lead with the specific service and location, and place the CTA above the fold. No distractions.
Organic blog CTA: Visitors arrived for information, not to buy immediately. Use a softer CTA (“Download our free checklist” or “See how we handle this for local businesses”) rather than a hard “Call Now.”
Identity resolution is a growing advantage for service businesses. When a visitor browses your pricing page but never fills a form, identity resolution tools can match that anonymous session to a known contact record and trigger a follow-up sequence automatically. Combined with effective follow-up sequences, this approach converts visitors who would otherwise disappear permanently.
The minimum instrumentation to support basic personalization: GA4 audience segments, UTM parameters on every paid campaign, and a landing-page tool (Unbounce works well here) that lets you serve different page variants to different traffic sources without a developer.
Which technical fixes have the biggest impact on your conversion rate?
Fix page speed and mobile UX first. Then address Core Web Vitals and accessibility. In that order.
Even small improvements in page speed can noticeably increase retail conversions. That is not a rounding error. Run Google PageSpeed Insights and Lighthouse on your top landing pages today and note your Largest Contentful Paint (LCP) and Cumulative Layout Shift (CLS) scores. LCP above 2.5 seconds and CLS above 0.1 are the thresholds where you are likely losing conversions to frustration.
Top technical fixes by impact:
- Compress and convert hero images to WebP format (often cuts page weight by 40–60%)
- Defer non-critical JavaScript so the page renders before scripts load
- Implement a CDN to reduce latency for visitors outside your server’s region
- Remove unused CSS and third-party scripts (every unused plugin is a tax on load time)
- Use mobile-first responsive forms with large tap targets and autofill support
Quick diagnostic checklist:
- Run Lighthouse in Chrome DevTools on your primary landing page
- Check GTmetrix for waterfall view of which resources load slowest
- Test on a real mid-range Android device, not just desktop Chrome
- Verify that your contact form and CTA button are visible without scrolling on a 375px screen
For making your website mobile-friendly, the stakes are real: a majority of online shoppers use their phones as their primary shopping device, and local service searches skew even more heavily mobile.
Accessibility improvements reduce friction for users with assistive needs and often improve conversion for everyone. Add descriptive alt text to images, ensure color contrast meets WCAG 2.1 AA standards, and make sure your forms are navigable by keyboard. These are not optional extras; they are table stakes for a site that wants to convert the broadest possible audience.
How do you measure real conversion lift and avoid attribution mistakes?
Use multiple converging measurement methods: GA4 funnel data, your experiment log, and incremental holdout groups where possible. Any single method in isolation can mislead you.
What to include in a conversion lift report:
- Baseline conversion rate and volume (pre-test period, same traffic sources)
- Test design: hypothesis, variants, traffic split, and planned duration
- Sample sizes per variant and actual run duration
- Confidence interval and statistical significance at close
- Segmented results (did mobile and desktop behave differently?)
- Business impact: incremental conversions multiplied by average lead or order value
Incrementality checklist:
- Run holdout groups where possible (5–10% of traffic sees the control permanently)
- Document every test in a shared experiment log with start date, end date, result, and decision
- Avoid launching tests during major promotional periods or traffic anomalies
- Check for novelty effect: a new design often gets a short-term lift that fades; run tests long enough to see stabilization
Common attribution mistakes:
- Last-click attribution in GA4 overcredits the final touchpoint and undercredits email, retargeting, and organic content that warmed the visitor
- Calling a winner after 3 days because the numbers look good (seasonality, not signal)
- Comparing conversion rates across different traffic sources without segmenting (paid traffic converts differently than organic; mixing them hides both signals)
Recovery automations triggered by high-intent behaviors (pricing page visit, cart abandon, form start without submit) are among the highest-impact post-visit conversion drivers. Build these into your measurement framework so you credit them correctly and do not double-count them against your on-site experiment results.
What does a realistic CRO timeline and budget look like?
Quick fixes and one or two focused tests can produce measurable lift in 1–4 weeks. A full CRO program with continuous testing takes 3–6 months to show compounding results.
| Phase | Timeframe | Typical Activities | Expected Lift Range | Traffic Needed |
|---|---|---|---|---|
| Quick fixes | Week 1–2 | Headline rewrite, CTA copy, image compression | Varies by baseline | Any |
| First A/B test | Week 2–6 | Single variable test on primary landing page | Varies by test | 200+ conversions/variant |
| Test sprint (3–5 tests) | Month 1–3 | Prioritized ICE list, form reduction, trust signals | Cumulative gains | Moderate to high |
| Continuous CRO program | Month 3+ | Ongoing test cycles, personalization, retargeting | Compounding | High |
Cost ranges (estimates):
- DIY tools: GA4 is free. Google Tag Manager is free. Hotjar starts at no cost for low-traffic sites. Unbounce starts around $99/month. Optimizely is enterprise-priced and typically requires a sales conversation.
- Contractor or one-off project: A scoped CRO audit from a freelancer typically runs $500–$2,500 depending on site complexity. A single landing-page redesign and test setup runs $1,000–$5,000.
- Agency retainer: Full-service CRO retainers from specialized agencies typically range from $2,000–$8,000 per month, depending on scope, traffic volume, and whether paid media management is included.
When to move from DIY to agency:
- Your site gets enough traffic to run valid tests but your team lacks bandwidth to run them consistently
- You have run two or three tests and are not sure whether the results are statistically valid
- Your conversion rate has been flat for more than 90 days despite changes
- You are spending on paid ads but your landing pages have never been tested
How City Web Company approaches CRO for local service businesses
City Web Company’s process follows a four-phase structure: audit, prioritized test sprint, scale winners, and retainer optimization that expands into paid channels.
Phase 1: Audit (weeks 1–2)
Deliverables include a GA4 funnel analysis, session recording review, ICE-scored opportunity list, and a baseline conversion report. The audit identifies the three highest-impact changes to test first.
Phase 2: 30-day sprint
Scope covers one to two A/B tests on the primary landing page, a form optimization, and technical quick fixes (image compression, mobile CTA placement). Each test runs with a documented hypothesis and a pre-set end date.
Phase 3: Scale winners
Changes that produce statistically significant lift get rolled out site-wide. Losing tests get documented and archived. The experiment log becomes a permanent asset.
Phase 4: Retainer optimization
Ongoing monthly testing, personalization rule updates, and integration with paid media campaigns (Google Ads, social ads) so landing pages match ad creative and intent.
City Web Company works with home service companies, HVAC contractors, plumbers, pest control operators, med spas, and other local service businesses. The agency’s web design and development services include conversion-focused builds, not just aesthetic redesigns. For readers who want to see how the process applies to their specific business type, the digital marketing guide for local business growth walks through the full channel strategy alongside CRO.
Note: Author bio, specific case study metrics, and client testimonials will be added here with verified assets from City Web Company’s client records.
Key Takeaways
A focused CRO program that fixes value-proposition clarity, removes form friction, and runs prioritized A/B tests against a GA4 baseline produces the fastest, most measurable conversion lifts for local service businesses.
| Point | Details |
|---|---|
| Set one primary KPI first | Define a single conversion goal (call, form, purchase) before running any test or making any change. |
| Headline clarity beats UX tweaks | Value proposition clarity has roughly three times the impact on conversions as minor friction reductions. |
| Test with statistical discipline | Require 200+ conversions per variant and run tests across at least two full business cycles before calling a winner. |
| Fix speed and mobile UX early | A 0.1-second page speed improvement can increase retail conversions; mobile-first fixes compound that gain. |
| City Web Company runs the full program | City Web Company’s audit-to-retainer process covers ICE scoring, A/B testing, form optimization, and paid-channel integration for local service businesses. |
What actually works for local service businesses (a practitioner’s view)
The pattern that shows up repeatedly across local service sites is this: the business owner spent months on SEO and ad spend, drove real traffic, and then lost most of it to a homepage that leads with the company name instead of the service outcome. The fix is not a redesign. It is one headline change and a phone number that is actually clickable on mobile.
Value-proposition clarity and a prominent click-to-call CTA are the two highest-return changes for local service businesses, and they cost almost nothing to test. A plumber whose hero section reads “Denver’s Trusted Plumbing Experts Since 2003” will almost always outperform after changing it to “Same-Day Plumbing in Denver. Licensed. Upfront Pricing. Call Now.” The specificity does the work.
Simplified booking forms matter more than most owners realize. A six-field form asking for name, email, phone, address, service type, and preferred date is already too long for a mobile visitor who found you through a Google search at 9 PM with a burst pipe. Two fields and a phone number will convert that visitor. The longer form can come after the call.
On urgency: the ethical version works. A genuine “We have 2 appointment slots left this week” from a business that actually has 2 slots left is honest and effective. A fake countdown timer is not. Visitors who catch manufactured urgency do not just leave; they leave with a negative impression that spreads. The behavioral economics research is clear that authentic scarcity outperforms fake urgency on both short-term conversion and long-term trust.
The last thing worth saying plainly: most conversion problems are not design problems. They are clarity problems. The visitor does not understand what you do, who it is for, or what happens next. Fix the message before you redesign the page.
City Web Company can audit and fix your conversion rate
If your site is getting traffic but not generating enough calls, form submissions, or booked appointments, the gap is almost always identifiable and fixable. City Web Company runs conversion audits for local service businesses that produce a prioritized fix list, not a generic report.
The audit covers GA4 funnel analysis, session recording review, mobile UX assessment, and an ICE-scored opportunity list. From there, you choose a one-time sprint project or an ongoing retainer that includes continuous testing, paid media landing-page alignment, and monthly reporting.
Sprint projects start with a scoped audit. Retainers include ongoing A/B testing, form optimization, and integration with your Google Ads and social campaigns. To see the full scope of what City Web Company offers local service businesses, visit the digital marketing services page or request a consultation directly. If you are ready to stop guessing which page changes will move your numbers, that is the right next step.
Useful sources and tools for going deeper
The resources below are organized by your next step. Open the one that matches where you are right now.
- Shopify’s CRO guide: Start here if you want a clear definition of the CRO process and how to structure your first program. Covers the iterative cycle from hypothesis to measurement.
- HubSpot’s CRO strategy guide: Best for goal-setting and understanding which KPIs to track. Particularly useful for the goal-definition step before you instrument GA4.
- Google PageSpeed Insights: Run your primary landing page URL here first. The report gives you LCP, CLS, and FID scores with specific fix recommendations.
- Microsoft Clarity: Free heatmap and session recording tool. Install it alongside GA4 as your baseline qualitative layer before spending on Hotjar.
- Unbounce reviews on G2: Read verified user reviews before committing to Unbounce for landing-page experiments. Particularly useful for understanding how non-developers experience the platform.
FAQ
How do I increase my website conversion rate quickly?
Start with your hero headline and primary CTA. Rewrite both to lead with a specific outcome and a clear next step, then run a form-reduction test. These two changes consistently produce the fastest measurable lift without requiring a full redesign.
Is a 7% conversion rate good?
It depends entirely on the channel and business type. A 7% rate is strong for most e-commerce categories and exceptional for paid search landing pages, where 2–5% is a more typical benchmark. For local service lead forms, 7% is achievable and worth targeting.
Why is my website conversion rate so low?
The most common causes are a value proposition that does not match visitor intent, too many form fields, and a CTA that is not visible on mobile. Check your GA4 funnel report to find the specific step where visitors exit, then focus your first test there.
How do I increase conversion value, not just volume?
Segment your conversions by lead source and service type in GA4. Identify which traffic sources produce the highest-value customers, then allocate more budget and testing effort to those channels. City Web Company’s retainer programs include this kind of channel-level attribution analysis as part of ongoing optimization.
How much traffic do I need before A/B testing makes sense?
You need enough traffic to reach 200+ conversions per variant within a reasonable test window (typically 2–4 weeks). If your site cannot hit that threshold, use qualitative methods (session recordings, user interviews, heatmaps) to guide high-confidence changes instead of running underpowered tests.
Recommended
These articles were popular with other readers too: